ECOLOGY AND ENERGY PRODUCTION

ECOLOGY AND ENERGY PRODUCTION

Friday, December 3, 2021


Where the housing market is going in 2022 as told by 7 leading forecast
models


A perfect storm. That's the best way to describe the red-hot housing market we've seen from coast-to-coast during the pandemic. It was spurred by a combination of recession-induced low mortgage rates, remote work allowing buyers to sprawl further away from their workplace, and a demographic wave of first-time millennial homebuyers entering into the market. Of course, years of under-building means there simply aren't enough homes available to meet this demand. Cue record price growth.


But how much longer will this run last? After all, home price appreciation of 19.9%—a 12-month record set between Aug. 2020 and Aug. 2021—can't be sustained forever.

Already, there are signs the housing boom is losing some steam. We're seeing seasonality—a cooling period that happens like clockwork most years—return to the market after it was absent during the holiday and vacation stretch last year. That's not all: More homebuyers are finally beginning to push back against surging prices. Indeed, in October 60.3% of sales involved a bidding war, which is down from the all-time high in April (74.5%). There's also the increased likelihood the Federal Reserve will raise rates to tamp down inflation. Rising mortgage rates would price out some buyers altogether.


What does this mean for home price growth in 2022? To find out, Fortune reviewed seven industry forecast models. But buyers and sellers alike won't get much peace of mind from these forecasts: The economic models don't produce anything close to a consensus. Some of these forecast models predict price growth next year will go down as one of the highest on record. Others are forecasting a rate of appreciation that would be the slowest in more than a decade.


Let's take a look at these models—and also look at why there's so much uncertainty heading into next year.


On the high end of the spectrum are Zillow and Goldman Sachs. Zillow projects home prices will rise 13.6% between Oct. 2021 and Oct. 2022. Meanwhile, Goldman Sachs forecasts a 16% uptick between Oct. 2021 and Dec. 2022 (or 13.5% on an annualized basis). For perspective, the largest 12-month uptick in the lead up to the 2008 housing crash was 14.1%. Simply put: Researchers at both Zillow and Goldman Sachs see priced out buyers falling further behind next year.


“The supply-demand picture that has been the basis for our call for a multiyear boom in home prices remains intact...Of all the shortages afflicting the U.S. economy, the housing shortage might last the longest," wrote Goldman Sachs in its 2022 outlook.

What's going on? Well, neither Zillow nor Goldman Sachs foresees the demographic wave of first-time millennial homebuyers letting up. We’re in the midst of the five-year period (between 2019 and 2023) in which the five largest millennial birth years (between 1989 and 1993) are hitting the all-important first-time home buying age of 30. According to their forecasts, there won't be enough homes to satisfy all of that demand next year.

Since 1980, Fortune calculates home prices on average have climbed 4.6% per year. Over the past year, price growth (19.9%) is four times that level.


The good news for would-be home buyers? Among the seven forecast models Fortune examined, four predict we'll see price growth in 2022 fall back closer to the historical average. That includes Fannie Mae and Freddie Mac, which are predicting U.S. home price growth of 7.9% and 7%. That's slightly higher than the historical norm, however, it's hardly the eye-popping numbers we've seen during the pandemic. Meanwhile, models released by Redfin and CoreLogic foresee 12-month price growth falling to 3% and 1.9%, respectively.

What do the models predicting substantial price deceleration have in common? They foresee price growth getting chopped down by rising mortgage rates. As of Monday, the average 30-year fixed mortgage rate stands at just 3.1%. By the end of 2022, Fannie Mae projects it'll hit 3.4% while Redfin's model says 3.6%. Those jumps are bigger than they might appear at first glance. Let's say a borrower took on a $500,000 mortgage. At a 3.1% mortgage rate, they'd see a $2,135 monthly payment (not factoring in any taxes or insurance). But if that rate were the 3.6% as projected by Redfin, that payment would rise to $2,273—or nearly an additional $50,000 over the course of the 30-year mortgage.

Another unknown: Will corporate America begin pushing harder next year to bring staffers back into the office? If the workplace is less WFH friendly next year, that could translate into fewer buyers in both second home markets (like the Hamptons) and in the exurbs. That concern is shared by Frank Martell, CEO of CoreLogic, who wrote in the real estate data firm's latest forecast that "as we head into 2022, we expect some moderation in the current pattern of flight away from urban cores as the pandemic wanes.”

But there is one outlook that is relatively bearish on price growth.

The Mortgage Bankers Association, an industry trade group, is predicting that the median price of existing homes will decrease by 2.5% between the fourth quarter of 2021 and the fourth quarter of 2022. When you look closely at its model, it's easy to see why: The Mortgage Bankers Association is forecasting that the average 30-year fixed mortgage rate will hit 4% by the end of 2022. Over the course of 30 years, that'd add an additional $90,000 in cost to a $500,000 fixed rate mortgage


That said, even if the Mortgage Bankers Association's price drop comes to fruition, it'd hardly be a housing crash. In fact, in that scenario, U.S. home prices would still be up over 20% from pre-pandemic levels.


Monday, November 29, 2021

p> 


The Philippines is a frontline of another cold war


Like in the Cold War, the United States is attempting to contain the influence of a great power rival in Southeast Asia. To counter China, the United States' approach to its relationship with the Philippines invokes déjà vu. Despite the passing of decades, the players, strategy and results remain the same.

First, the players. Many who have studied U.S.-Philippines relations during the Cold War focus on the relationship between President Reagan and the infamous Philippine dictator Ferdinand Marcos. This is because Ronald Reagan was the quintessential "cold warrior" whose administration attempted to counter communist influence by supporting U.S.-aligned dictators the world over.


What gets less attention is President Carter's own complicity in propping up the Marcos regime. Carter, often categorized as a human rights-focused president, supported the Marcos regime after the declaration of martial law in the Philippines in an effort to keep U.S. access to military bases on the archipelago. While it is debatable whether Joe Biden is the new Jimmy Carter, he is a Democratic president who is claiming that his administration prioritizes human rights while navigating relationships with regimes that have dubious human rights records.

On the Philippines side, the comparison of President Rodrigo Duterte to Ferdinand Marcos is obvious: Duterte's drug war, encouragement of extrajudicial killings, shuttering of critical media and scoffing at international law echo the Marcos regime's myriad abuses. What's more, the children of both Marcos and Duterte are running on both parents' legacies in the Philippines presidential election.

Second, the strategy. The Philippines is, once again, seen as a geopolitically necessary bulwark against a superpower that threatens U.S. hegemony in the region. And again, the U.S. approach to containment is a prioritization of military superiority against China through access to bases on the Philippines.

To maintain access to these bases, the U.S. buys off the Philippine government with a steady stream of security assistance, turns a blind eye when atrocities are committed with said security assistance and reassures the Philippine government of lasting support whenever international or domestic criticisms are made.

Like in the first Cold War, the Philippine government is being given materials to engage domestic enemies, not foreign aggressors. Even with the most recently proposed arms sale of 10 F-16 fighter jets and a Harpoon Block II anti-ship missile system, the Philippines is no match for full-scale combat with the Chinese military and must rely on the military might of the U.S. to protect it. This approach does not foster sovereignty and self-determination; it leads to dependency and lackeyism.


Lastly, the results. In both cold wars, ordinary citizens at the crossroads of conflict were sacrificed. During the regime of Ferdinand Marcos, it is estimated that 3,257 people were murdered and 35,000 were tortured by the U.S.-backed Philippine security state. As of now, estimates put Duterte and his security forces' body count at approximately 30,000; this does not figure in the recent spate of killing human rights defenders. Along with Duterte's killings, his crackdown on critical media and political opposition mirrors Marcos's approach to dissent. As with most reigns of terror, we will not know the gravity or magnitude of the abuses committed until the regime has long disappeared.

What happened after Marcos's ouster was a critical reevaluation by the Filipino people of the Philippines' relationship with the United States due to the United States' unwavering support of Marcos.

As a result, the reawakened democracy voted in 1991 not to ratify a treaty that allowed the U.S. access to bases in the Philippines. It wasn't until 2014, with the signing of the Enhanced Defense Cooperation Agreement, that the U.S. was allowed to fully station bases in the Philippines. If the U.S. is determined to follow the exact same approach in the new cold war with regards to the Philippines, a similar backlash is bound to occur.

Setting aside the questionable utility of participating in another cold war, the United States owes it to the people of the Philippines not to repeat the mistakes we made in the first Cold War. This starts with distancing ourselves from human rights abusers who will cause more harm than good in the long term, and taking steps to demonstrate that human rights are a priority.

One substantial way to do this is to limit U.S. military aid to the armed forces of the Philippines and Philippine National Police. By withholding security assistance until perpetrators of human rights violations are held accountable for their actions, the U.S. creates an incentive for the government of the Philippines to develop a framework to address human rights concerns and gives the U.S. moral consistency when criticizing other states of human rights abuses.


Sunday, November 7, 2021


Temperatures and sea levels are rising all over the world. Low-lying coastal cities are already dealing with disastrous floods and are desperately trying to find innovative ways to combat rising sea levels. Here are ten sinking cities that will soon be underwater.

The climate
disaster is here


Earth is already becoming unlivable. Will governments act to stop this disaster from getting worse?


b


The enormous, unprecedented pain and turmoil caused by the climate crisis is often discussed alongside what can seem like surprisingly small temperature increases – 1.5C or 2C hotter than it was in the era just before the car replaced the horse and cart.

These temperature thresholds will again be the focus of upcoming UN

climate talks at the COP26 summit in Scotland as countries variously dawdle or scramble to avert climate catastrophe. But the single digit numbers obscure huge ramifications at stake. “We have built a civilization based on a world that doesn’t exist anymore,” as Katharine Hayhoe, a climate scientist at Texas Tech University and chief scientist at the Nature Conservancy, puts it.

The world has already heated up by around 1.2C, on average, since the preindustrial era, pushing humanity beyond almost all historical boundaries. Cranking up the temperature of the entire globe this much within little more than a century is, in fact, extraordinary, with the oceans alone absorbing the heat equivalent of five Hiroshima atomic bombs dropping into the water every second.

When global temperatures are projected to hit key benchmarksthis century
Average global surface temperature relative to a 1850-1900 baseline


Worst-case scenario

An unlikely pathway

where emissions

are not mitigated


Intermediate

A pathway where

emissions start

declining around 2040


Best-case

An unlikely pathway where

emissions start declining now and

global temperatures peak at +1.8C


Projected

to increase

by +1. 5C

+2.7F


2021


2050


2080


9 years


In 6


to 8 years


+2.0C

+3.6F


In 20


to 30 years


+2.5C

+4.5F


In 32


to 56

years


+3.0C

+5.4F


In 43 years

at the earliest

Guardian graphic. Source: IPCC, 2021: Summary for Policymakers. Note: The IPCC scenarios used for best-case, intermediate and worst-case scenarios are SSP1-2.6, SSP2-4.5 and SSP5-8.5.

Until now, human civilization has operated within a narrow, stable band of temperature. Through the burning of fossil fuels, we have now unmoored ourselves from our past, as if we have transplanted ourselves onto another planet. The last time it was hotter than now was at least 125,000 years ago, while the atmosphere has more heat-trapping carbon dioxide in it than any time in the past two million years, perhaps more.

Since 1970, the Earth’s temperature has raced upwards faster than in any comparable period. The oceans have heated up at a rate not seen in at least 11,000 years. “We are conducting an unprecedented experiment with our planet,” said Hayhoe. “The temperature has only moved a few tenths of a degree for us until now, just small wiggles in the road. But now we are hitting a curve we’ve never seen before.”

No one is entirely sure how this horrifying experiment will end but humans like defined goals and so, in the 2015 Paris climate agreement, nearly 200 countries agreed to limit the global temperature rise to “well below” 2C, with an aspirational goal to keep it to 1.5C. The latter target was fought for by smaller, poorer nations, aware that an existential threat of unlivable heatwaves, floods and drought hinged upon this ostensibly small increment. “The difference between 1.5C and 2C is a death sentence for the Maldives,” said Ibrahim Mohamed Solih, president of the country, to world leaders at the United Nations in September.

There is no huge chasm after a 1.49C rise, we are tumbling down a painful, worsening rocky slope rather than about to suddenly hit a sheer cliff edge – but by most standards the world’s governments are currently failing to avert a grim fate. “We are on a catastrophic path,” said António Guterres, secretary general of the UN. “We can either save our world or condemn humanity to a hellish future.”

Heatwaves

Earth’s atmosphere, now saturated with emissions from human activity, is trapping warmth and leading to more frequent periods of extreme heat
Oregon, US
June 2021: A cooling shelter
Yokohama, Japan
July 2021: Staff sprinkles water to cool down patrons
Seville, Spain
August 2021: A billboard shows 47C (117F)
Karachi, Pakistan
September 2021: A zookeeper bathes an elephant

Photographs: Clockwise from top-left, Maranie Staab/Reuters, Yuichi Yamazaki/Getty Images, Rizwan Tabassum/AFP via Getty Images, Cristina Quicler/AFP via Getty Images


This year has provided bitter evidence that even current levels of warming are disastrous, with astounding floods in Germany and China, Hades-like fires from Canada to California to Greece and rain, rather than snow, falling for the first time at the summit of a rapidly melting Greenland. “No amount of global warming can be considered safe and people are already dying from climate change,” said Amanda Maycock, an expert in climate dynamics at the University of Leeds.

A “heat dome” that pulverized previous temperature records in the US’s Pacific northwest in June, killing hundreds of people as well as a billion sea creatures roasted alive in their shells off the coast, would’ve been “virtually impossible” if human activity hadn’t heated the planet, scientists have calculated, while the German floods were made nine times more likely by the climate crisis. “The fingerprint of climate change on recent extreme weather is quite clear,” said Michael Wehner, who specializes in climate attribution at Lawrence Berkeley National Laboratory. “But even I am surprised by the number and scale of weather disasters in 2021.”

Frequency and intensity of once-a-decade heatwave events


Global

warming

level


Increase in

heatwave

temperature


Heatwave

frequency


Historical

1850-1900


A once-a-decade event ...


-


+1.0C

Present


... now happens 2.8x a decade


+1.2C


+1.5C

In 6-8 years


4.1x


+1.9C


+2.0C

In 20-30 years


5.6x


+2.6C


+4.0C

Unlikely this

century


9.4x


+5.1C

Guardian graphic. Source: IPCC, 2021: Summary for Policymakers. Note: The projected year ranges for when warming thresholds will be hit are based on IPCC scenarios SSP2-4.5 and SSP5-8.5.

After a Covid-induced blip last year, greenhouse gas emissions have roared back in 2021, further dampening slim hopes that the world will keep within the 1.5C limit. “There’s a high chance we will get to 1.5C in the next decade,” said Joeri Rogelj, a climate scientist at Imperial College London.

For humans, a comfortably livable planet starts to spiral away the more it heats up. At 1.5C, about 14% of the world’s population will be hit by severe heatwaves once every five years. with this number jumping to more than a third of the global population at 2C.

Beyond 1.5C, the heat in tropical regions of the world will push societies to the limits, with stifling humidity preventing sweat from evaporating and making it difficult for people to cool down. Extreme heatwaves could make parts of the Middle East too hot for humans to endure, scientists have found, with rising temperatures also posing enormous risks for China and India.

A severe heatwave historically expected once a decade will happen every other year at 2C. “Something our great-grandparents maybe experienced once a lifetime will become a regular event,” said Rogelj. Globally, an extra 4.9 million people will die each year from extreme heat should the average temperature race beyond this point, scientists have estimated.

At 2C warming, 99% of the world’s coral reefs also start to dissolve away, essentially ending warm-water corals. Nearly one in 10 vertebrate animals and almost one in five plants will lose half of their habitat. Ecosystems spanning corals, wetlands, alpine areas and the Arctic “are set to die off” at this level of heating, according to Rogelj.

Change in fraction of land annually exposed to heatwaves:


+1.5C

+2.7F

We'll reach this threshold


In 6


to 8 years


Change from 1986-2006
0+61.8%
Insufficient model agreement

Guardian graphic. Source: Climate Analytics. Note: In the data, a heatwave is when a relative indicator based on air temperature and an absolute indicator based on the air temperature and relative humidity are projected to exceed exceptionally high values, according to an analysis of four climate models. When the two of the four models don’t agree, they are not visualized.


In the next decade, heatwaves could make the American South, Central America, Cuba and coastal regions of Mexico much less livable.


By the end of the century, the hottest regions of North America may be unlivable without major adaptions.

Floods

Earth’s hotter climate is causing the atmosphere to hold more water, then releasing the water in the form of extreme precipitation events
Kolkata, India
September 2021: A woman exits a bus onto a flooded street
Agen, France
September 2021: Firefighters inspect a flooded street
Al Khaburah, Oman
October 2021: Flooded streets after Cyclone Shaheen
Ayutthaya, Thailand
October 2021: A boy walks through floodwaters

Photographs: Clockwise from top-left, Indranil Aditya/NurPhoto via Getty Images, Philippe Lopez/AFP via Getty Images, Jack Taylor/AFP via Getty Images, Oman News Agency via AP


Across the planet, people are set to be strafed by cascading storms, heatwaves, flooding and drought. Around 216 million people, mostly from developing countries, will be forced to flee these impacts by 2050 unless radical action is taken, the World Bank has estimated. As much as $23tn is on track to be wiped from the global economy, potentially upending many more.

Some of the most dire impacts revolve around water – both the lack of it and inundation by it. Enormous floods, often fueled by abnormally heavy rainfall, have become a regular occurrence recently, not only in Germany and China but also from the US, where the Mississippi River spent most of 2019 in a state of flood, to the UK, which was hit by floods in 2020 after storms delivered the equivalent of one month of rain in 48 hours, to Sudan, where flooding wiped out more than 110,000 homes last year.

Frequency and intensity of once-a-decade heavy precipitation events


Global

warming

level


Heavy precipitation

frequency


Increase in

wetness


Historical

1850-1900


A once-a-decade event ...


-


+1.0C

Present


... now happens 1.3x a decade


+6.7%


+1.5C

In 6-8 years


1.5x


+10.5%


+2.0C

In 20-30 years


1.7x


14.0%


+4.0C

Unlikely this

century


2.7x


+30.2%

Guardian graphic. Source: IPCC, 2021: Summary for Policymakers. Note: The projected year ranges for when warming thresholds will be hit are based on IPCC scenarios SSP2-4.5 and SSP5-8.5.

Meanwhile, in the past 20 years the aggregated level of terrestrial water available to humanity has dropped at a rate of 1cm per year, with more than five billion people expected to have an inadequate water supply within the next three decades.

At 3C of warming, sea level rise from melting glaciers and ocean heat will also provide torrents of unwelcome water to coastal cities, with places such as Miami, Shanghai and Bangladesh in danger of becoming largely marine environments. The frequency of heavy precipitation events, the sort that soaked Germany and China, will start to climb, nearly doubling the historical norm once it heats up by 2C.

Change in the mass of precipitation:


+1.5C

+2.7F

We'll reach this threshold


In 6


to 8 years


Change from 1986-2006
0+36.0%-2.6%
Insufficient model agreement

Guardian graphic. Source: Climate Analytics. Note: The data shows where rainfall and snowfall are projected to change compared to the 1986-2006 average, according to an analysis of four climate models. When the two of the four models don’t agree, they are not visualized.


The earth's warming in the next decade will likely cause less rainfall in the northwest region of the US, as well as central America and the Caribbean islands.


The southern parts of the continent will likely experience periods of severe drought by the end of the century, while the north-east US in particular gets increasing amounts of extreme rainfall.

Wildfires

Earth’s hotter atmosphere soaks up water from the earth, drying out trees and tinder that amplify the severity of wildfires
Woololoo, Australia
February 2021: A wildfire destroyed over 30 homes
Ogan Ilir, Indonesia
August 2021: Indonesian firefighters try to extiguish a peatland fire
Chefchaouen, Morocco
August 2021: A woman looks at wildfires tearing through a forest
California, US
September 2021: Flames consume a house in the Fawn Fire

Photographs: Clockwise from top-left, Greg Bell/DFES via AP, Muhammad A.F/Anadolu Agency via Getty Images, Ethan Swope/AP, Fadel Senna/AFP via Getty Images


Virtually all of North America and Europe will be at heightened risk of wildfires at 3C of heating, with places like California already stuck in a debilitating cycle of “heat, drought and fire”, according to scientists. The magnitude of the disastrous “Black Summer” bushfire season in Australia in 2019-20 will be four times more likely to reoccur at 2C of heating, and will be fairly commonplace at 3C.

A disquieting unknown for climate scientists is the knock-on impacts as epochal norms continue to fall. Record wildfires in California last year, for example, resulted in a million children missing a significant amount of time in school. What if permafrost melting or flooding cuts off critical roads used by supply chains? What if storms knock out the world’s leading computer chip factory? What happens once half of the world is exposed to disease-carrying mosquitos?

“We’ve never seen the climate change this fast so we don’t understand the non-linear effects,” said Hayhoe. “There are tipping points in our human-built systems that we don’t think about enough. More carbon means worse impacts which means more unpleasant surprises.”

Change in fraction of land annually exposed to wildfires:


+1.5C

+2.7F

We'll reach this threshold


In 6


to 8 years


Change from 1986-2006
0+0.2%
Insufficient model agreement

Guardian graphic. Source: Climate Analytics. Note: The data shows where the annual aggregated of areas burned by wildfires is projected to change, according to an analysis of four climate models. When the two of the four models don’t agree, they are not visualized.


The American West has already experienced unprecedented wildfires, but that's only going to get worse. In addition, Canada, Texas and parts of Mexico will also be at greater risk.


By the end of the century, virtually the entire continent will likely be at significantly greater risk of wildfires, regularly smothering the landmass in flames or smoke.

Crop failure

Unpredictable weather, like too much or too little rainfall, decreases the quantity and quality of crop yields
La Ceiba Talquezal, Guatemala
May 2017: Crops on a hillside damaged by deforestation, pests and prolonged droughts
New South Wales, Australia
October 2019: A farmer stands in a paddock of failed wheat crop
Lusaka, Zambia
January 2020: Poor crops after the lack of normal summer rainfall
Badghis, Afghanistan
September 2021: A farmer holds a handful of failed wheat from his crop

Photographs: Clockwise from top-left, Marvin Recinos/AFP via Getty Images, David Gray/Getty Images, String/EPA, World Food Program/Reuters


There are few less pleasant impacts in life than famine and the climate crisis is beginning to take a toll on food production. In August, the UN said that Madagascar was on the brink of the world’s first “climate change famine”, with tens of thousands of people at risk following four years with barely any rain. Globally, extreme crop drought events that previously occurred once a decade on average will more than double in their frequency at 2C of temperature rise.

Heat the world a bit more than this and a third of all the world’s food production will be at risk by the end of the century as crops start to wilt and fail in the heat.

Frequency of once-a-decade crop drought events


Global

warming

level


Crop drought

frequency


Historical

1850-1900


A once-a-decade event ...


+1.0C

Present


... now happens 1.7x a decade


+1.5C

In 6-8 years


2.0x


+2.0C

In 20-30 years


2.4x


+4.0C

Unlikely this

century


4.1x

Guardian graphic. Source: IPCC, 2021: Summary for Policymakers. Note: The projected year ranges for when warming thresholds will be hit are based on IPCC scenarios SSP2-4.5 and SSP5-8.5.

Many different aspects of the climate crisis will destabilize food production, such as dropping levels of groundwater and shrinking snowpacks, another critical source of irrigation, in places such as the Himalayas. Crop yields decline the hotter it gets, while more extreme floods and storms risk ruining vast tracts of farmland.

Change in fraction of land annually exposed to crop failure:


+1.5C

+2.7F

We'll reach this threshold


In 6


to 8 years


Change from 1986-2006
0+2.4%
Insufficient model agreement

Guardian graphic. Source: Climate Analytics. Note: The data shows where the annual yield of four crops (maize, wheat, soybean, and rice) is projected to fall short of the 2.5th percentile of pre-industrial levels, according to an analysis of four climate models. When the two of the four models don’t agree, they are not visualized.


Crop failures in the US midwest and Mexico will likely get worse in the next decade.


By the end of the century, Mexico and Central America, a region already seeing farmers turn into climate migrants, will likely experience significantly worse crop yields.


Despite the rapid advance of renewable energy and, more recently, electric vehicles, countries still remain umbilically connected to fossil fuels, subsidizing oil, coal and gas to the tune of around $11m every single minute. The air pollution alone from burning these fuels kills nearly nine million people each year globally. Decades of time has been squandered – US president Lyndon Johnson was warned of the climate crisis by scientists when Joe Biden was still in college and yet industry denial and government inertia means the world is set for a 2.7C increase in temperature this century, even if all emissions reduction pledges are met.

By the end of this year the world will have burned through 86% of the carbon “budget” that would allow us just a coin flip’s chance of staying below 1.5C. The Glasgow COP talks will somehow have to bridge this yawning gap, with scientists warning the world will have to cut emissions in half this decade before zeroing them out by 2050.

“2.7C would be very bad,” said Wehner, who explained that extreme rainfall would be up to a quarter heavier than now, and heatwaves potentially 6C hotter in many countries. Maycock added that much of the planet will become “uninhabitable” at this level of heating. “We would not want to live in that world,” she said.

A scenario approaching some sort of apocalypse would comfortably arrive should the world heat up by 4C or more, and although this is considered unlikely due to the belated action by governments, it should provide little comfort.

Every decision – every oil drilling lease, every acre of the Amazon rainforest torched for livestock pasture, every new gas-guzzling SUV that rolls onto the road – will decide how far we tumble down the hill. In Glasgow, governments will be challenged to show they will fight every fraction of temperature rise, or else, in the words of Greta Thunberg, this pivotal gathering is at risk of being dismissed as “blah, blah, blah”.

“We’ve run down the clock but it’s never too late,” said Rogelj. “1.7C is better than 1.9C which is better than 3C. Cutting emissions tomorrow is better than the day after, because we can always avoid worse happening. The action is far too slow at the moment, but we can still act.”


Tuesday, October 26, 2021


China's goal is domination, not cooperation. It's playing Biden and America for fools.


Explore the topics mentioned in this article


China has a well-deserved reputation for deceit.

That’s what makes a recent statement from China’s Vice Foreign Minister Le Yucheng so remarkable: It is honest. He said it’s “not realistic” to expect China to make a new pledge to reduce greenhouse gas emissions.

There’s every reason to believe him, but the Biden administration is ignoring reality.


President Joe Biden’s Special Envoy for Climate, John Kerry, has embarked on a quixotic diplomatic quest to get China to cooperate with the United States and do something meaningful to combat climate change.

China might say there’s a climate crisis in a non-binding joint statement with the United States, but its real goal is to become the world’s dominant power — a dangerous prospect for the United States and China’s neighbors.

One reason China gets away with this is because it has made the most of its “developing” country status in the United Nation’s Framework Convention on Climate Change. Under this treaty, developing countries have far fewer responsibilities.
China is far from a 'developing' nation

The Framework Convention was signed in 1992, a time when China really was a developing country. Since then, its economy has grown more than 1,000% and its emissions more than 250%. It’s now the world’s second largest economy and largest emitter — twice as large as the United States.

Despite this, in an April 16 video meeting with Mr. Kerry, Chinese Vice Premier Han Zheng argued that as the largest developing and developed countries, China and the United States should observe their “common but differentiated responsibilities.” A polite way of saying, “You first.”

The Paris Agreement Mr. Kerry negotiated in 2015 did nothing to get rid of this developed-developing country divide. It perpetuated it instead. China could volunteer to be included among the developed nations, but that would mean giving up its strategic advantage. It won’t do that, so instead we have a commitment from China that allows it to emit with abandon until at least 2030.

Chinese Vice Minister of Foreign Affairs Le Yucheng on April 16, 2021, in Beijing.


This Photo Sums Up America’s Advantage Over China in the Indo-Pacific


The U.S., U.K., Australia, and Japan recently participated in a giant naval exercise.


The Maritime Partnership Exercise 2021 included three aircraft carriers from three different countries.


Russia and China mirrored the exercise one day later off the coast of Japan.


Navies from four of the largest democracies in the world conducted a huge naval exercise in the Indian Ocean earlier this month—one that involved not one, but three aircraft carriers.


Between October 15 and 18, the United States, United Kingdom, Japan, and Australia took part in the Maritime Partnership Exercise (MPX) 2021 in the Bay of Bengal in the Indian Ocean. The exercise was designed to increase interoperability between the four sea services. A day later, Chinese and Russian navies conducted a similar exercise.


The U.S. Navy sent the California-based aircraft carrier USS Carl Vinson, as well as her escorts, the guided-missile cruiser USS Lake Champlain, destroyer USS Stockdale, and the replenishment oiler USNS Yukon.


Photo credit: U.S. Navy photo by Mass Communication Specialist 2nd Class Russell Lindsey


The Royal Navy's Carrier Strike Group 21—which includes the aircraft carrier HMS Queen Elizabeth (above)—also participated. Queen Elizabeth is on her maiden voyage, one that saw her and her battle group sail across the Indo-Pacific as far east as Guam. "Big Lizzie's" escorts included the destroyers HMS Defender, USS The Sullivans, frigates HMS Kent and HMS Richmond, and fleet auxiliary RFA Fort Victoria.


Japan's Maritime Self-Defense Force sent the ships JS Kaga and JS Murasame. Kaga, originally a "helicopter destroyer," is set to become a full-fledged aircraft carrier (along with her sister ship Izumo), embarking F-35B fighter jets. Rounding out the international task force was the Royal Australian Navy's frigate HMAS Ballarat and refueling tanker HMAS Sirius.


The four-power exercise (and others like it) is meant to push back against China's growing naval power in the Indo-Pacific, demonstrating solidarity and the ability to work together against a powerful adversary. Military alliances across the region mean that the U.S. Navy has access to the bases of allies closer to where the potential action is, and can bolster its own naval forces with local forces. For locals like Japan and Australia, it means the ability to call on the 500-pound gorilla of naval warfare if regional tensions rise or if war became imminent.


Photo credit: Japan Ministry of Defense


One day after the exercise, a Sino-Russian joint task force set out to prove the same capabilities. Ten warships from the Russian Navy and the People's Liberation Army Navy (PLAN) sailed through the Tsugaru Strait into the North Pacific. The Tsugaru Strait separates the Japanese northern island of Hokkaido from the main island of Honshu. Japanese air and naval forces first observed the flotilla, which provided the photos above to the Japanese Ministry of Defense.


The five Chinese ships included one brand-new Renhai-class guided-missile cruiser; Nanchang, the largest surface combatant in the PLAN; the guided-missile destroyer Kunming; and the frigates Binzhou and Liuzhou. Rounding out the Chinese complement was a Type 903 fuel and ammunition replenishment ship.


Photo credit: Japan Ministry of Defense

Russia's contribution consisted of ships from Moscow's Pacific Fleet, including two Udaloy-class frigates, two Steregushchy-class corvettes, and the Marshal Krylov space-tracking ship. The two frigates were constructed before the Cold War and were originally destroyers before an upgrade, after which they were downgraded to frigates.

The Indo-Pacific region is coalescing into two power blocs, as these two parallel exercises make abundantly clear. On one side are the navies of the world's major democracies, including regional democracies. On the other side are the authoritarian countries Russia and China. While this doesn't mean the world is any closer to war, it does show that, when it comes to geopolitics, birds of a feather flock together. Whether or not they'll fight together is something the world is better off not finding out.
Meanwhile, China is perfectly willing to exploit Western climate change concerns for its own ends. Fueled by subsidies, the Chinese solar industry has cornered the global market. They have stifled innovation and caused many cutting-edge companies in America and Europe to call it quits. China now supplies more than two-thirds of all solar modules. Chinese companies also make up seven of the top 10 wind turbine manufacturers.

Unrealistic expectations: Joe Biden is right to be blunt with Russia and China, but wrong on what to do next

Key parts of Chinese solar panels are manufactured in Xinjiang province, where the Muslim Uyghur minority is used as forced labor. Though the Chinese government denies this, it has not permitted independent inspectors access to the manufacturing facilities. A big red flag for an entire green industry.

Where it can’t innovate advanced energy technologies, China isn’t above stealing them. The recent Annual Threat Assessment from the Director of National Intelligence warned that the Chinese are specifically targeting the American defense, energy, and finance sectors. It reports the Chinese have no qualms with using espionage and theft as means to steal American technologies.
Don't surrender US energy advantage

We’re seeing almost weekly news stories detailing how researchers connected to China’s military and intelligence services have penetrated our universities and research institutions. They are exploiting the free exchange of ideas to pilfer intellectual property. We need to wake up to the threat.

China is also making an effort to control the critical materials used in many defense and energy technologies. It’s positioned itself as a critical cog in the mining and processing of copper, lithium, nickel, cobalt, and rare earths. It’s also heavily involved in the sectors that use these materials, like battery, solar panel, and wind turbine production.

None of this is an accident. It’s a conscious geopolitical and commercial strategy.

Beijing's oppression: Why is Chinese leader Xi Jinping so afraid of Hong Kong and Jimmy Lai?

After achieving energy self-reliance, it would be a mistake to surrender America’s energy advantage. We should not turn our energy dominance over to the whims of foreign powers like China that are actively seeking America’s decline. Undermining America’s energy security will not solve climate change.

Mr. Kerry’s pursuit of international cooperation with China on climate change is sadly predictable, but China is not in the cooperation business. It’s in the global domination business.

China pretends it’s a developing country, steals technology, uses forced labor, and manipulates markets to its advantage.

During his speech to Congress, President Biden said he wants to make “sure every nation plays by the same rules in the global economy, including China.” Yet his administration seems determined to fall for China’s grand deception. China is playing the United States for the fool.

Sunday, October 24, 2021


THE COUNTER TO CHINESE  HYPERSONIC NUCLEAR MISSILES: A US DRONE SUBORBITAL AIRCRAFT POWERED BY ANTI GRAVITY OR NUCLEAR PROPULSION LOADED WITH HYPERSONIC NUCLEAR MISSILES


Area 51, secret U.S. Air Force military installation located at Groom Lake in southern Nevada. It is administered by Edwards Air Force Base in southern California. The installation has been the focus of numerous conspiracies involving extraterrestrial life, though its only confirmed use is as a flight testing facility. For years there was.........


Booster rocket failure stops U.S. hypersonic weapon test

A booster rocket carrying a hypersonic glide body failed to launch Thursday morning during a test by the Defense Department's hypersonic weapons program.

"The test did not occur as planned due to a failure of the booster stack," Defense Department spokesman Lieutenant Commander Tim Gorman told CBS News in a statement about the attempted test, which took place in Alaska. Gorman stressed the failure was not related to the hypersonic technology, just the booster.

"The booster stack used in the test was not part of the hypersonic program and is not related to the Common Hypersonic Glide Body. The missile booster is used for testing purposes only."
The test took place at the Pacific Spaceport Complex-Alaska in Kodiak, and was conducted to inform hypersonic technology development. Despite the setback, the department is still on track to fielding offensive hypersonic capabilities in the early 2020s, according to Gorman.
A precision sounding rocket. / Credit: Courtesy of U.S. Navy

Hypersonic weapons can travel within the upper atmosphere at five times the speed of sound.

The failed test comes after the Navy and Army successfully tested precision sounding rockets Wednesday. The rockets take measurements that aid in U.S. hypersonic development.

"During weapon system development, precision sounding rocket launches fill a critical gap between ground testing and full system flight testing," The Navy said in a statement. The statement went on to say that launches like this one would help speed the development of offensive and defensive hypersonic technology.

The U.S. tests come amid reports that China has been testing hypersonic weapons.

The Financial Times reported China conducted a test of a nuclear-capable hypersonic missile in August. The hypersonic glide vehicle flew through low orbit towards its target and only missed by about 24 miles. The Daily Mail also reported China had conducted another test in July.

On Wednesday, President Biden said he was concerned by the reported Chinese tests.

Secretary of Defense Lloyd Austin was also asked about China's alleged tests this week and declined to comment, but he told the reporters traveling with him to Tblisi, Georgia, that the U.S. keeps a close watch on the development of China's military capabilities.

"You heard me say before that China is a challenge, and we're going to remain focused on that," Austin said.

Propulsion Technologies

If the performance required of a UAV is similar to the performance of conventional aircraft, the propulsion system may also be similar. Many UAVs will weigh more than 1,000 pounds, fly at subsonic and supersonic velocities at altitudes below 60,000 feet, maneuver at 9g’s or less, and will be maintained in ways similar to current military or commercial aircraft. These UAVs will not require unique propulsion technology. Indeed, many new aircraft of all types are designed to use existing engines to avoid the time and expense of developing new engines. This chapter discusses UAV concepts that require new propulsion technology.

Some classes of UAV require new engine technology, new designs, or even new fundamental research and propulsion concepts. For example, a UCAV may require a gas turbine engine that can operate at much more than the 9g forces that limit manned vehicles. For high g loadings, the entire engine structure, especially the rotor support, will have to be reevaluated. An engine capable of maneuvering at 30g, for example, would require new design concepts that could require considerable engineering development but not new basic research. Nevertheless, for some UAVs, the propulsion system is a critical limiting technology. These include subsonic HALE aircraft that must operate above the altitude limits of current engine technologies; MAVs; and very low-cost, high-performance vehicles.

BACKGROUND

In addition to thrust, propulsion systems for modern aircraft must provide high fuel economy, low weight, small size (to limit drag), and extremely high reliability. The primary engine performance metrics are minimum total fuel burn


Suggested Citation:"5 Propulsion Technologies." National Research Council. 2000. Uninhabited Air Vehicles: Enabling Science for Military Systems. Washington, DC: The National Academies Press. doi: 10.17226/9878.
×

(while meeting aircraft performance requirements) and reliability levels commensurate with permissible aircraft loss rate (1 per 108 departures for commercial aircraft). Many military missions also require stealth, which greatly affects engine design and installation. For all types of aircraft (including UAVs), engines and fuel typically account for 40 percent to 60 percent of gross takeoff weight, and the performance of the propulsion system has an enormous effect on air vehicle performance (Figure 5-1).

The gas turbine engine is vastly superior to alternative engines in all propulsion metrics. This high level of performance reflects the intrinsic merits of the concept and the $50 billion to $100 billion invested in gas turbine research and development over the past 50 years. The power-to-weight ratio of gas turbines is three to six times that of aircraft piston engines. The difference in reliability is even greater. The in-flight shutdown (IFSD) rate, a measure of reliability, for gas turbine engines in large commercial aircraft is 0.5 shutdowns for every 105 hours of flight. For single-engine military jet aircraft, the IFSD rate is 2 for every 105 hours. The IFSD rate for light aircraft piston engines is considerably worse, about 5 to 10 for every 105 hours. Although the IFSD statistics are not available for small piston engines in current UAVs, anecdotally, they are even higher. Gas turbines can also operate for long periods of times (4,000 to 8,000 hours) between overhauls, compared to 1,200 to 1,700 hours for aircraft piston engines. The small piston engines in current UAVs are replaced every 100 hours or less of service. The attractiveness of small piston engines is their low cost and the lack of availability of high-performance gas turbines in very small sizes. Alternative propulsion concepts may only be desirable when suitable gas turbines are not available.
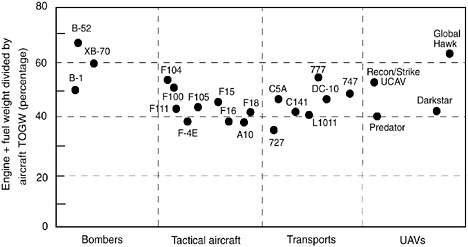
FIGURE 5-1 Propulsion system weight (engine plus fuel) as a percentage of aircraft takeoff gross weight (TOGW).


Suggested Citation:"5 Propulsion Technologies." National Research Council. 2000. Uninhabited Air Vehicles: Enabling Science for Military Systems. Washington, DC: The National Academies Press. doi: 10.17226/9878.
×

Both energy density and power density are important factors for propulsion systems. Energy density is a measure of the energy in the fuel and the conversion efficiency of the power converter (engine). Power density is a measure of the power converter. For example, the propulsion system weight of a long-range transport aircraft is dominated by the energy density of the fuel consumed (which may be 10 times the weight of the engines). In contrast, a solar-powered vehicle has zero fuel weight and, thus, very high energy density but low power density (the solar cells and power storage system are heavy). Figure 5-2 illustrates the range of power and energy densities for current UAVs.

Most air vehicles require about twice as much power for takeoff and climbing than for cruising. Therefore, the design of the propulsion system is a compromise between the weight of the engine (power-to-weight ratio) required for takeoff and the fuel weight required for cruising range (e.g., engine efficiency). The interactions between these factors for particular power system technologies will be discussed below.

Development cost has been a major factor for UAV propulsion systems in the past. The development of an all-new gas turbine engine for a tactical military aircraft can cost more than $1 billion, an inconceivable expense for the UAVs developed to date. Thus, the practice has been to adapt existing devices in a very budget-constrained, suboptimal manner, usually by sacrificing both performance and reliability. The cost of new technology, especially new concepts, will be as high for UAVs as it has been for conventional aircraft unless new ways for developing propulsion systems can be perfected.
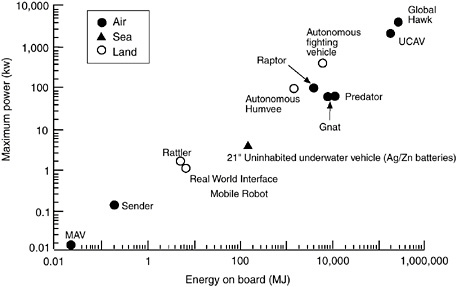

FIGURE 5-2 Characteristics of propulsion and power systems for UAVs.


Suggested Citation:"5 Propulsion Technologies." National Research Council. 2000. Uninhabited Air Vehicles: Enabling Science for Military Systems. Washington, DC: The National Academies Press. doi: 10.17226/9878.
×

BASIC RESEARCH

The range of UAV missions and applications is restricted by the lack of an adequate propulsion system. Missions that may be desirable but require the development of propulsion technology include very high-altitude (above 65,000 feet) vehicles, long-endurance reconnaissance/surveillance/communications relay vehicles, MAVs, and very low-cost, high-performance UCAVs.

High-Altitude, Long-Endurance UAVs

Substantial efforts are under way to develop propulsion technologies for HALE surveillance and communications-relay missions. The mission objectives for HALE UAVs are to operate at as high an altitude as possible to maximize the geographic coverage of sensors and communications. High altitude can also be an important contributor to survivability because high altitude reduces the aircraft’s vulnerability to ground-to-air and air-to-air missiles. However, to be entirely safe from many widely deployed threats, operating altitudes must be above 75,000 or even 85,000 feet. These altitudes cannot be routinely reached with current propulsion technology.

At an altitude above 75,000 feet, there is very little air (the air density at 80,000 feet is only 3 percent of the density at sea level), which affects air-breathing fueled propulsion systems in two fundamental ways. First, engine weight is inherently higher. The fuel required to produce a unit of thrust per time is the same at high altitudes as it is at low altitudes, but the fuel-to-air ratio is fixed by the chemistry of combustion. As a result, the required mass flow rate of air is set by the power required.

Second, the large compression ratios required for gas turbines (additional compressor stages must be added), piston engines, and fuel cells (which require several stages of turbocharging) result in weight and drag penalties. The additional compression requirement significantly increases the weight of high-altitude propulsion systems. Because the compression process increases the temperature as well as the air pressure, the required pressure ratios result in temperatures that are too high for current technology. Thus, coolers (heat exchangers) must be added to the compression system. The weight and drag penalties of these heat exchangers are exacerbated by the very low ambient air density. High-altitude aircraft under development for NASA, which use piston engines, have more area and drag associated with heat exchangers than for the wings. The increased weight and drag of heat exchangers with altitude limit the operating altitude of these designs (Drela, 1996).

Areas for research include technology leading to low-weight, low-drag heat exchangers and low-weight, low Reynolds number, high-efficiency compression systems. These technologies will be important for both gas turbine and internal combustion engines, as well as for fuel cell systems (described below).

Page 63
Suggested Citation:"5 Propulsion Technologies." National Research Council. 2000. Uninhabited Air Vehicles: Enabling Science for Military Systems. Washington, DC: The National Academies Press. doi: 10.17226/9878.
×

Propulsion approaches other than combustion engines have been proposed, notably fuel cells (Stedman, 1997) and solar power. Fuel-cell systems have the potential advantage of high energy densities but have relatively low power densities. Turbochargers and heat exchangers similar to those for piston engines would be required at high altitude. Unless fuel cells can operate on hydrogen (whose low density makes it difficult to integrate into an air vehicle), their complexity and weight quickly dominate the design. No liquid fuel systems are in routine operation today, and none has been designed for use in air vehicles. Fuel cells might be useful for very long-endurance missions for which fuel consumption is the dominant factor.

Because of the relatively low energy density of solar radiation, solar-powered aircraft must be extremely light and efficient, and they require exceptionally careful operation. Thus, they are probably only viable for niche military applications. The principal technology requirements for solar-powered aircraft are lighter, more efficient solar cell designs and compact, lightweight energy storage systems (for night operation).

Micro Air Vehicles

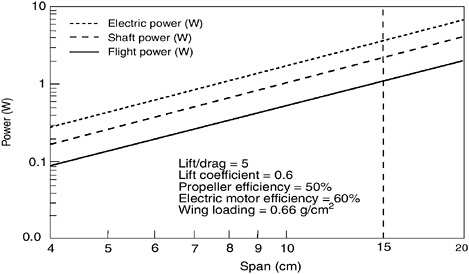
MAVs are currently defined by DARPA as having characteristic dimensions of less than 15 cm. This makes propulsion and power for MAVs very challenging indeed. A study was conducted by the Massachusetts Institute of Technology’s Lincoln Laboratory on both the propulsion requirements and the technology options available to meet these requirements (Davis et al., 1996). Figure 5-3 illustrates how the amount of power required varies as a function of vehicle size for a class of conventional airplane configurations. In the figure, the flight power curve refers to the power (thrust times flight velocity) the vehicle requires for level flight. (Climbing and maneuvering may require 50 percent to 100 percent more power than level flight.) The flight power requirement is independent of the type of propulsion system. The shaft power curve in the figure refers to the mechanical power a motor must provide with a propeller propulsion system, regardless of the type of motor (e.g., electric, internal combustion, gas turbine). Assuming that the motor is electric, the electric power curve then represents the power that must be supplied by the source of electricity. Thus, vehicles of this type need on the order of 3 to 5 watts for cruising and 6 to 10 watts for climbing.

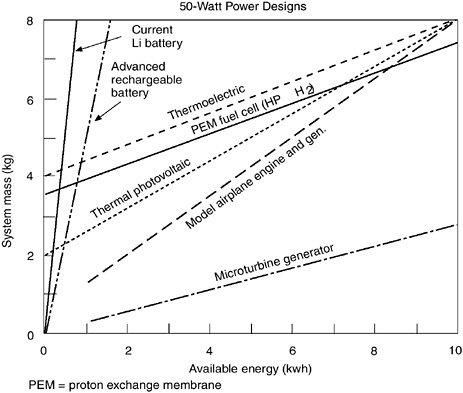
Conceptually, different propulsion systems have different relationships between motor weight and fuel weight, so the relative, overall mass of the propulsion system is a function of flight duration requirements. Figure 5-4 shows the trade-offs at the 50-watt level that would be required for some of the less power-efficient UAV concepts (e.g., hovering vehicles) (NRC, 1997b). Table 5-1 illustrates the propulsion system mass (including fuel where appropriate) to propel a vehicle with a takeoff weight of 50 grams for various flight times with different power systems (the only option that has been demonstrated is electrically driven
Page 64
Suggested Citation:"5 Propulsion Technologies." National Research Council. 2000. Uninhabited Air Vehicles: Enabling Science for Military Systems. Washington, DC: The National Academies Press. doi: 10.17226/9878.
×

FIGURE 5-3 Typical power requirements for propeller-powered MAVs. Source: Massachusetts Institute of Technology, Lincoln Laboratory.

propellers). The nominal weight allowance for propulsion in the design is 36 grams; thus weights of more than 36 grams do not meet the specified flight times. The most attractive (lowest total weight) propulsion systems are airbreathing systems. The current DARPA MAV program is investigating four propulsion options: batteries, microdiesels, fuel cells, and micro gas turbines. The last three are projected to have about the same fuel consumption per unit power, but the micro gas turbine is considerably smaller and lighter.

Low-Cost, High-Performance UAVs

Reliable aircraft propulsion systems are expensive to develop, manufacture, and operate. Typical list prices range from $130 to $200 per pound of thrust for civilian engines and $200 to $400 per pound for military engines (civilian engine prices generally include amortization of the development costs; military engine prices do not). The price per pound increases as size is reduced because of relatively higher development costs and engine accessory costs (e.g., fuel pumps, controls, and electrical generators). Even “low-cost,” short-lived (10-hour) cruise missile engines cost about $150 per pound. With current technology, an engine designer can trade off lower cost for lower performance by selecting less expensive materials and manufacturing approaches and reducing the number of parts. The most important question for many UAVs will be how to realize high performance while dramatically reducing costs, especially in the smaller engine sizes.
Page 65
Suggested Citation:"5 Propulsion Technologies." National Research Council. 2000. Uninhabited Air Vehicles: Enabling Science for Military Systems. Washington, DC: The National Academies Press. doi: 10.17226/9878.
×

FIGURE 5-4 System mass vs. energy for several advanced, small energy systems. Source: Massachusetts Institute of Technology, Lincoln Laboratory.

Significant cost reduction over the lowest cost with current technology will require advances in fluid mechanics, heat transfer, and materials technologies that emphasize cost instead of performance, which is traditionally emphasized. For example, increases in airfoil and end-wall boundary-layer loading can reduce the number of compressor and turbine stages, as well as the number of airfoils per stage. These increases might be realized through progress in passive (e.g., suction or casing treatment) or active (e.g., involving feedback) boundary-layer control.

Another example would be reducing the cost of hot sections (combustors and turbines) through the development of low-cost, high-temperature materials and coatings. An alternative approach would be to develop new cooling schemes that would reduce the cost of producing air-cooled parts. (A typical small engine may require drilling more than 100,000 cooling holes). Also, cooling is often less efficient in small engines because of limitations in manufacturing technology. Many fundamental problems with using vapor and liquid cooling approaches in engine environments will require basic research to be resolved.

Page 66
Suggested Citation:"5 Propulsion Technologies." National Research Council. 2000. Uninhabited Air Vehicles: Enabling Science for Military Systems. Washington, DC: The National Academies Press. doi: 10.17226/9878.
×

TABLE 5-1 Total Propulsion System Mass for 50-Gram MAV


Mass for 30-minute flight (in grams)

Mass for 60-minute flight (in grams)

Rocket (hydrogen-oxygen)

83

140

Pulse jet

45

80

Electric motor (0.38 W/gram, 60% efficient)

Batteries

55

79

Solara

35a

35a

Thermal photovoltaicb

25b

26b

Microturbine generator

20

24

Advanced fuel cell

25

31

Microfan jet

8

12

Internal combustion engine (5% efficient)

Otto cycle

13

22

Diesel cycle

9

13

Note: Propulsion system design mass is 36 grams

aSolar panel size may exceed the available surface area.

bExcludes cooling drag.

Another major issue for engines of all sizes, but increasingly important as engine size is reduced, is leakage flows through the clearances between stationary and rotating parts. These leakages have a first-order impact on engine efficiency and operability. Engine complexity and costs are increased significantly by design features to reduce leakage. New technology and approaches for airfoils, end-wall flows, seals, and thermostructural interaction could reduce the impact of leakage. One example that has been tried is shape-memory alloys to control compressor blade clearances (Schetky et al., 1998).

Gas bearings are feasible in small sizes and are used in small turbomachinery, such as APUs. If gas bearings were used in small aircraft engines, they could reduce the complexity and cost of the bearing and lubrication systems.

Currently, most military engines are designed for specific applications; thus development costs for each new aircraft are substantial. One radical approach to reducing these costs would be to develop a miniature, high-performance, low-cost engine that could be grouped to provide greater thrust. This “one-size-fitsall” approach, however, is well beyond the state of the art and would require basic research. Existing technology can produce only miniature, low-performance, high-cost (per unit thrust) engines. In addition to the advances discussed above, the technologies for this new approach would include very small, low-cost accessories. MEMS could be an important element in miniature engines.

Page 67
Suggested Citation:"5 Propulsion Technologies." National Research Council. 2000. Uninhabited Air Vehicles: Enabling Science for Military Systems. Washington, DC: The National Academies Press. doi: 10.17226/9878.
×

UNIQUE OR ENABLING APPLIED RESEARCH

Low-Cost, Storable, Limited-Life Propulsion Systems

As currently envisioned, propulsion systems for UAVs can be divided into two broad categories: (1) vehicles operated routinely in peacetime (e.g., highaltitude reconnaissance UAVs), and (2) vehicles used only in wartime, for which most, or even all, training will be done by simulation. Engines for the first category of UAVs will have conventional operations and maintenance requirements. But the requirements of store-in-peace/use-in-war vehicles will be closer to those of cruise missiles. These vehicles will require engineering solutions for subsystems, such as fuel and lubrication systems, that must be capable of unattended storage for years and very fast start-up.

Traditionally, much of the profit for manufacturers of gas turbines has come from the sale of spare parts to replace parts consumed during military training. If vehicles are used only in wartime, manufacturers will have little or no opportunity to sell spare parts in peacetime (and thus no industry geared up to produce them), necessitating a different pricing structure for these engines. Therefore, although overall engine-related program costs might be reduced, costs would be shifted from the operations and maintenance budget to the procurement budget (i.e., the purchase price of engines would increase).

Engines are now nominally optimized for minimum life-cycle costs under the current market structure. A different life cycle can have different optimal conditions. For a given thrust, the optimum design for a 500-cycle engine life in a UCAV will be different than for a 4,000-cycle life (typical for a modern fighter) or for a 20,000-cycle life (for commercial aircraft). These differences will be apparent, for example, in the lower requirements for material creep life, maintenance, and survivability. The lower requirements might also be reflected in the selection of materials (for lower cost and weight), lighter weight structures (especially rotating parts), and less emphasis on aging and maintainability characteristics (e.g., thinner airfoils, more welds, and fewer bolted joints).

Technology for storable engines already exists for cruise missiles and smaller engine sizes (700-lb. thrust and below) with very limited lives (tens of hours). However, this technology has not been used for larger engines (more than 1,000-lb. thrust) with longer lives (500 hours), which are contemplated for UCAVs.

Propulsion for High-Speed, Highly-Maneuverable UAVs

Current engine designs accommodate steady inertial loads compatible with human life (nominally up to 9g’s), as well as a capability to withstand additional impulsive loads from hard landings. (A typical military design requirement is illustrated in Figure 5-5.) If the maneuver envelope is increased for UCAVs, new

Page 68
Suggested Citation:"5 Propulsion Technologies." National Research Council. 2000. Uninhabited Air Vehicles: Enabling Science for Military Systems. Washington, DC: The National Academies Press. doi: 10.17226/9878.
×

FIGURE 5-5 Typical engine specifications for externally applied forces on takeoff, landing, and maneuvers.

Page 69
Suggested Citation:"5 Propulsion Technologies." National Research Council. 2000. Uninhabited Air Vehicles: Enabling Science for Military Systems. Washington, DC: The National Academies Press. doi: 10.17226/9878.
×

designs would have to be developed to accommodate the significantly increased g-loads. Without design changes and/or technological innovations, the higher load requirements would translate into higher weights. Steady-state, inverted flight, for example, would require the development of new bearing lubrication schemes. Even without preliminary design and system studies, it is clear that stiff, lightweight structures; better fluid-sealing; and high-load, low-life bearings will be required.

SUMMARY OF RESEARCH NEEDS

Most research on propulsion systems will benefit UAV applications. However, focused research will be needed to develop some types of UAVs. The research topics are summarized in Table 5-2.

TABLE 5-2 UAV Propulsion Technologies


Type of UAV


HALE

HSM

Very Low-Cost

General Topics

High-altitude propulsion

E


VTOL propulsion


E

Modeling

I

I

I

Cost reduction


I

I

Specific Topics

Low Reynolds number turbomachinery

E


E

Low Reynolds number heat rejection


E

Turbomachinery tip-clearance tolerance

I

E

E

Leakage desensitization


I

I

Thrust vectoring


I

I

Magnetic bearings

I

I


Air bearings


I

I

Solid lubricated bearings


I

I

Low-cost accessories


E

I

Low-cost vapor and liquid cooling schemes


I


Affordable high-temperature materials

I

I

I

Cooling for small engines


I

E

I = important

E = enabling

Page 70
Suggested Citation:"5 Propulsion Technologies." National Research Council. 2000. Uninhabited Air Vehicles: Enabling Science for Military Systems. Washington, DC: The National Academies Press. doi: 10.17226/9878.
×

Recommendation. The U.S. Air Force should include research on propulsion systems for UAV applications in its long-term research program. The following general research topics should be included:

  • high-altitude propulsion technologies, which may include gas turbines, internal combustion engines, solar-powered motors, or fuel cells

  • propulsion systems for small, highly maneuverable vehicles, including vertical takeoff and landing (VTOL) capabilities

  • computational modeling capability to reduce the need for engine testing during development

  • cost-reducing technologies that, for example, reduce parts count and complexity

The following specific research topics should be considered:

  • low Reynolds number turbomachinery, which is very important for both high-altitude operation and very small vehicles

  • low Reynolds number heat rejection for high-altitude coolers and for cooling very small propulsion systems at lower altitudes

  • turbomachinery tip-clearance desensitization (for highly loaded engines, high-altitude operation, and very small systems)

  • desensitization to leakage and better, cheaper seals to reduce cost and enhance performance for highly maneuverable and very small vehicles

  • thrust vectoring for highly maneuverable vehicles

  • magnetic, air, and solid lubricated bearings to improve long-term storage, enhance high-altitude operation, and reduce complexity and cost

  • technologies for low-cost accessories, which tend to dominate the cost of smaller engines

  • low-cost vapor and liquid cooling schemes and affordable high-temperature materials (e.g., structural, magnetic, and electronic materials)

  • more effective cooling technologies for small engines


U.S. Air Force (USAF) planners have envisioned that uninhabited air vehicles (UAVs), working in concert with inhabited vehicles, will become an integral part of the future force structure. Current plans are based on the premise that UAVs have the potential to augment, or even replace, inhabited aircraft in a variety of missions. However, UAV technologies must be better understood before they will be accepted as an alternative to inhabited aircraft on the battlefield. The U.S. Air Force Office of Scientific Research (AFOSR) requested that the National Research Council, through the National Materials Advisory Board and the Aeronautics and Space Engineering Board, identify long-term research opportunities for supporting the development of technologies for UAVs. The objectives of the study were to identify technological developments that would improve the performance and reliability of "generation-after-next" UAVs at lower cost and to recommend areas of fundamental research in materials, structures, and aeronautical technologies. The study focused on innovations in technology that would "leapfrog" current technology development and would be ready for scaling-up in the post-2010 time frame (i.e., ready for use on aircraft by 2025).